


If you work in planning, development or land acquisition, planning data isn’t just useful - it’s directional. It tells you where projects move, where they stall, and where your time is best spent.
The problem is that UK planning application data has never been built for easy analysis. Decisions are public, but they’re scattered across hundreds of local authority systems, published in different formats, and rarely structured for comparison. Even basic national benchmarking can turn into a manual research exercise.
That’s the gap we set out to close.
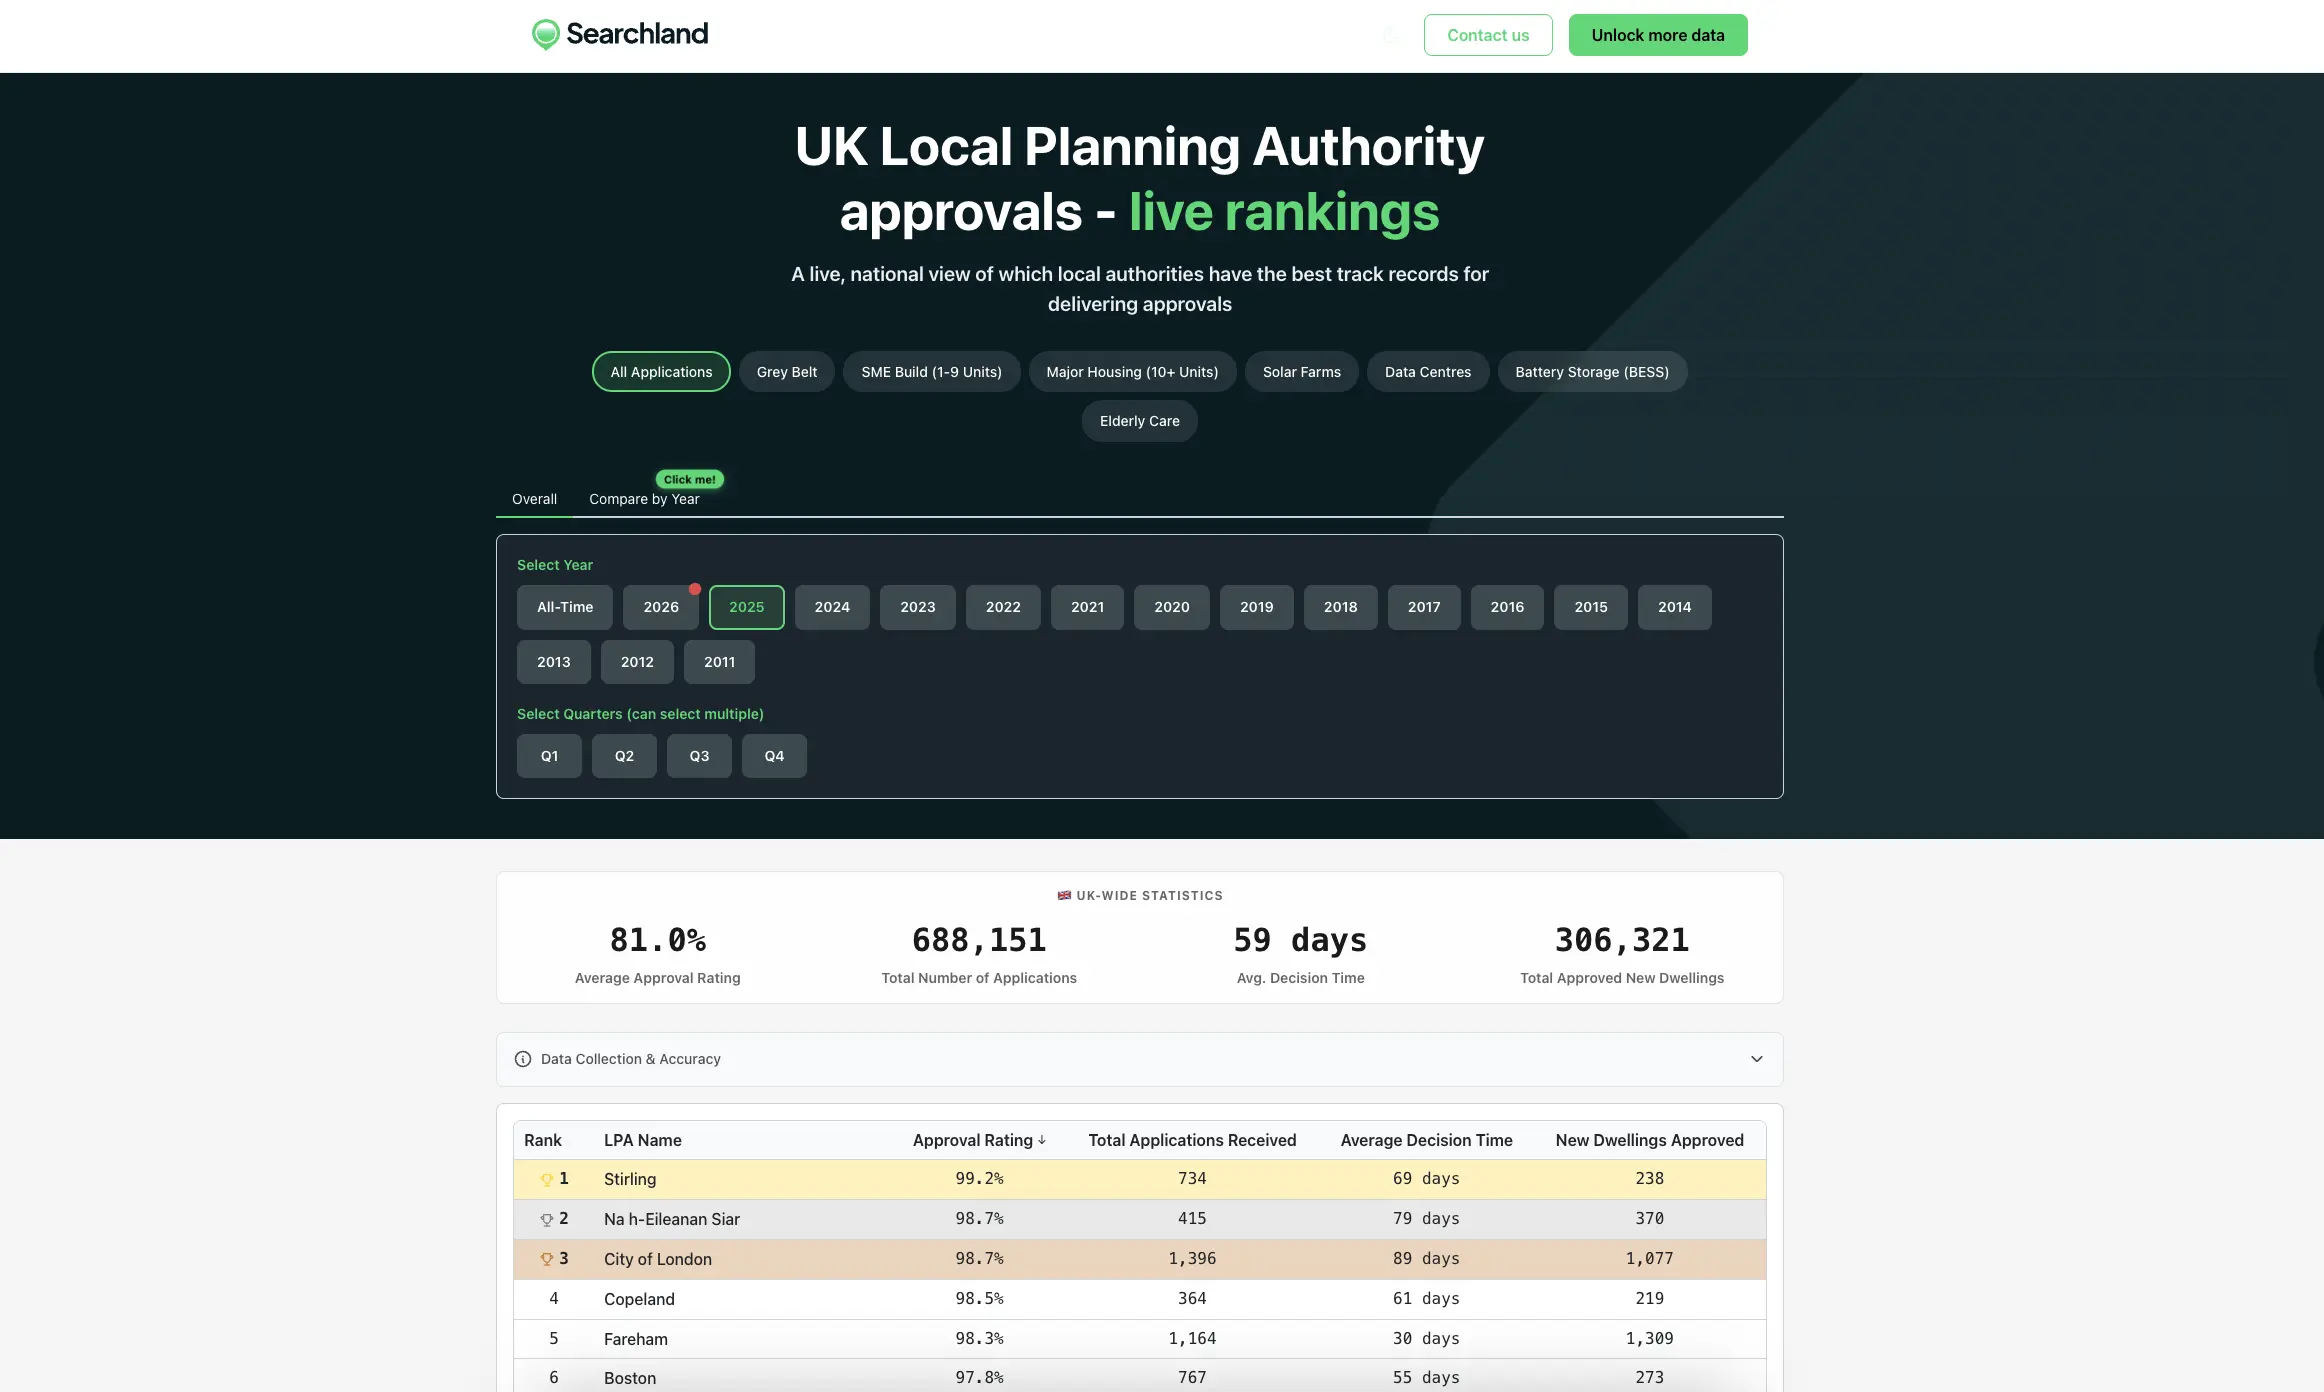
We built a live UK Local Planning Authority Planning Applications Leaderboard powered by more than a decade of planning decisions - from 2011 through to live 2026 outcomes - structured so teams can actually use it, not wrestle with it.
Here’s what the numbers actually show.
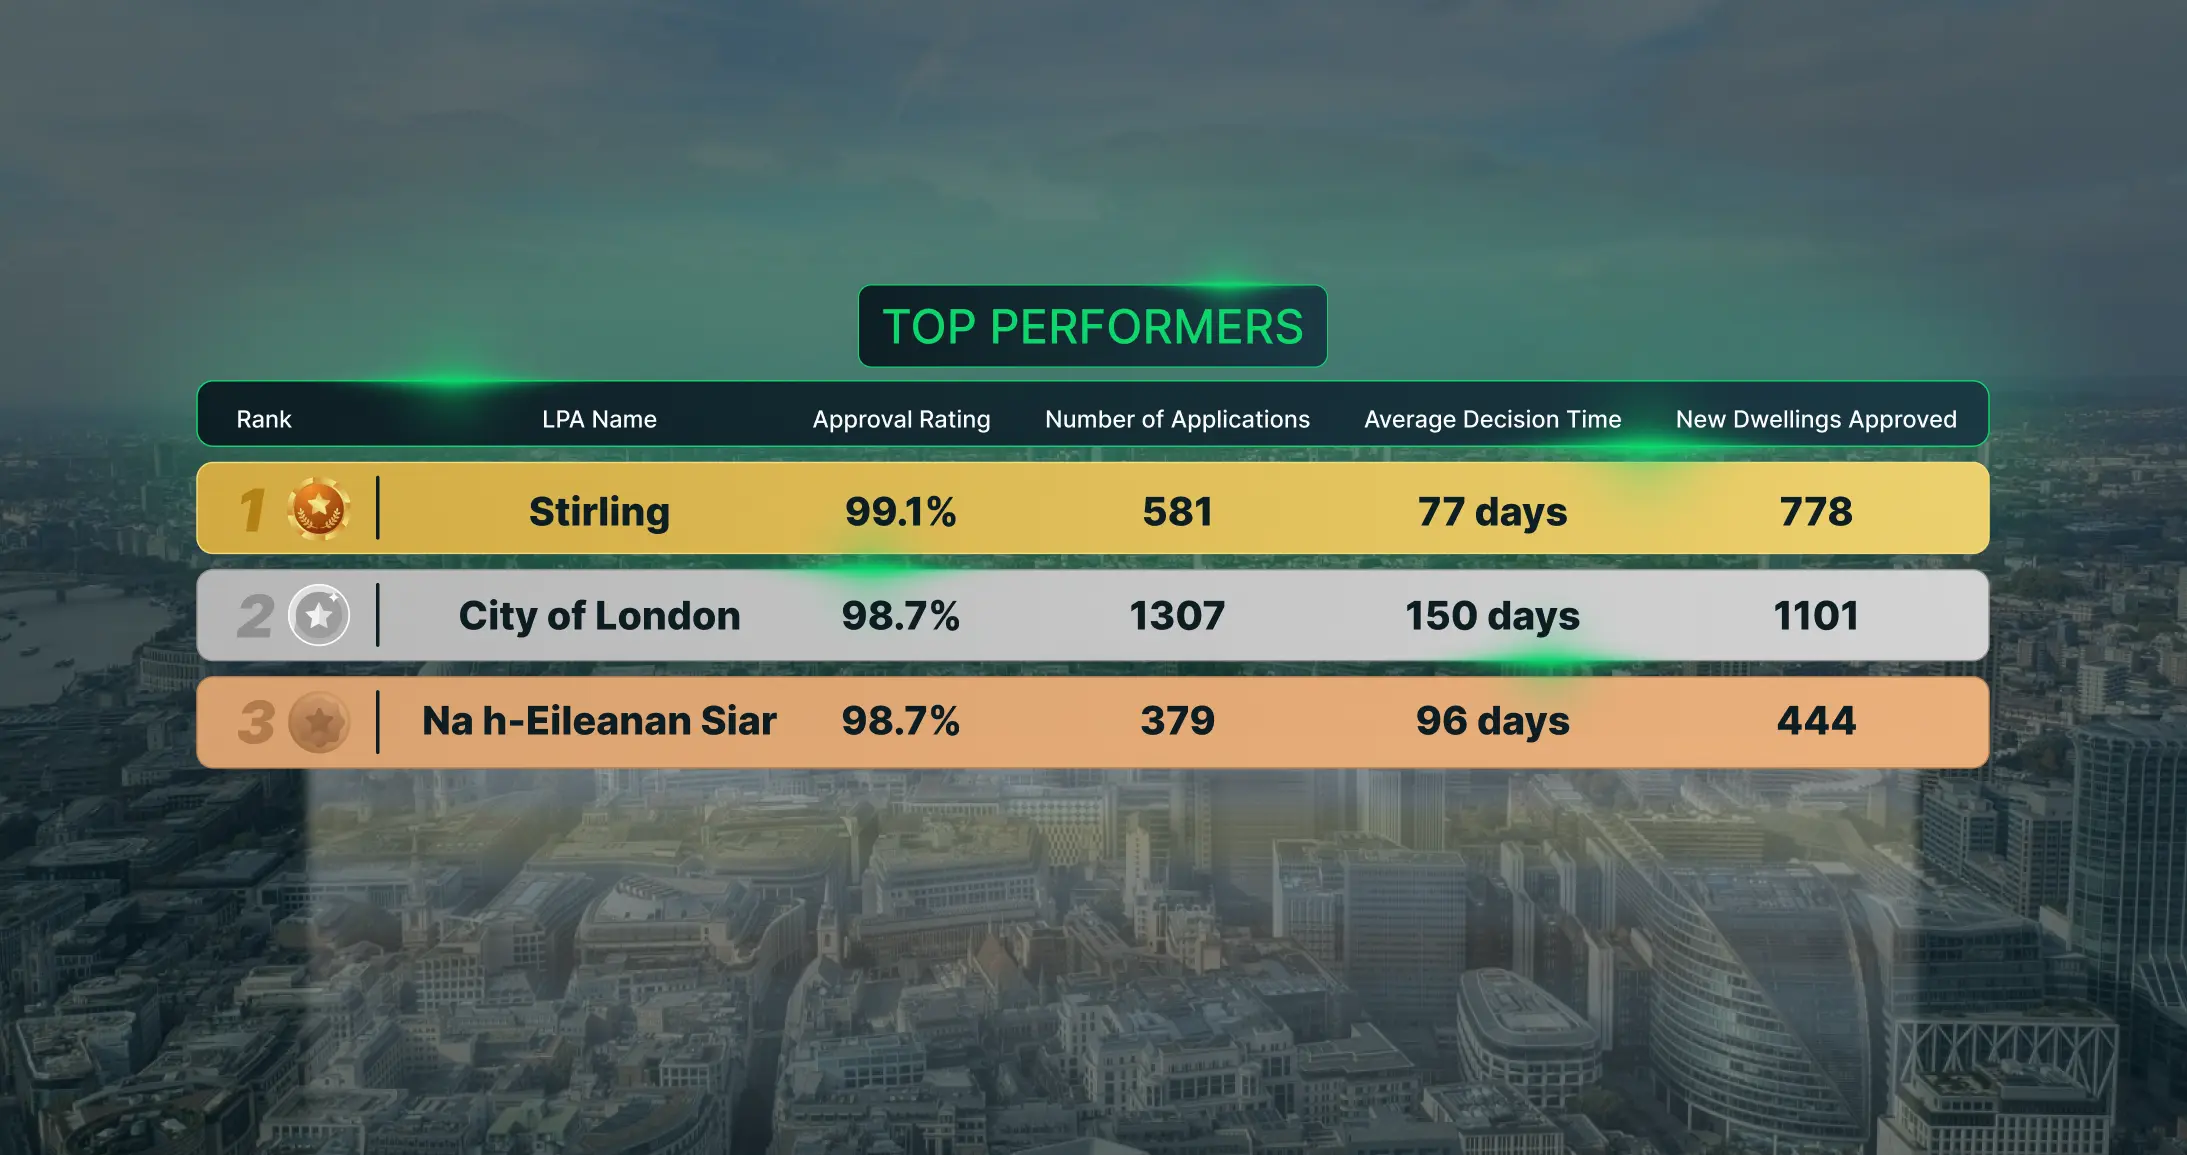
UK planning application statistics - latest snapshot (Searchland Data)
Based on Searchland’s national planning dataset:
- UK planning approval rate (2026 YTD): 81.3%
- 2025 planning approval rate: 81%
- Planning applications submitted in 2025: 688,151
- Average decision time 2025: ~60 days
- New dwellings approved in 2025: 306,321
UK planning application statistics 2021 - 2026
All figures come from Searchland’s planning application dataset covering every UK local planning authority.
👉 Explore the full live leaderboard
Why UK planning data is harder than it should be
Planning decisions are technically open data - but usable planning intelligence is not.
Most professionals hit the same wall. You start with a straightforward question about approval rates or council performance and quickly end up reconciling mismatched categories, missing years, and inconsistent labels across different portals.
The friction usually comes from a few recurring issues:
- Data spread across hundreds of council websites
- Decision types and labels that aren’t standardised
- Gaps and inconsistencies in historic coverage
- No shared framework for national comparison
- Limited visibility by sector or scheme type
So while the raw material exists, turning it into something decision-ready takes time. The leaderboard removes that prep work by standardising and aligning the dataset nationally.
A live leaderboard built for real planning decisions
The UK Local Planning Authority Planning Applications Leaderboard brings planning performance into one comparable national view instead of leaving it siloed authority by authority.
It’s designed for real-world planning questions - the kind you ask when you’re pressure-testing a site, a strategy, or a council area - not just headline stats.
You can move between authorities, years, and development types quickly, using consistent metrics throughout. Because the dataset updates continuously, the picture doesn’t go stale - it evolves as new decisions are made.
Think of it less like a report, more like a working planning intelligence layer.
Planning application data by year (2011–2026)
Planning outcomes only make sense in context. Approval rates shift with policy cycles, local plan stages, resourcing levels, and market pressure. A single year rarely tells the full story.
That’s why the leaderboard runs year-by-year from 2011 through to today, letting you zoom out for long-term patterns or zoom in on recent movement.
You can track how authority behaviour changes across cycles, compare today’s performance with historic baselines, and sense-check whether a spike or dip is structural - or temporary. Having the full timeline available changes how confidently teams can benchmark performance.
Recent planning approval trends (2023–2025)
The most recent completed years are especially useful for understanding how councils are reacting to current pressures - from housing delivery targets to workload constraints and policy reform.
Looking across 2023 to 2025 side by side reveals where determination volumes have shifted and where approval behaviour has tightened or loosened by development type. Some authorities remain stable. Others show clear directional change.
This is the range most teams use as their modern operating baseline - recent enough to be relevant, broad enough to show pattern instead of noise.
Live planning application data for 2026
Most planning datasets stop at the last full calendar year. That’s helpful for reporting, but less helpful for forward positioning.
The leaderboard includes live UK planning application decisions for 2026 and updates as outcomes are issued. That means you’re not waiting for an annual release cycle to understand what’s happening - you can see performance build in real time.
Practically, that allows teams to monitor approval direction as the year develops, spot early shifts, and adjust expectations sooner rather than later.
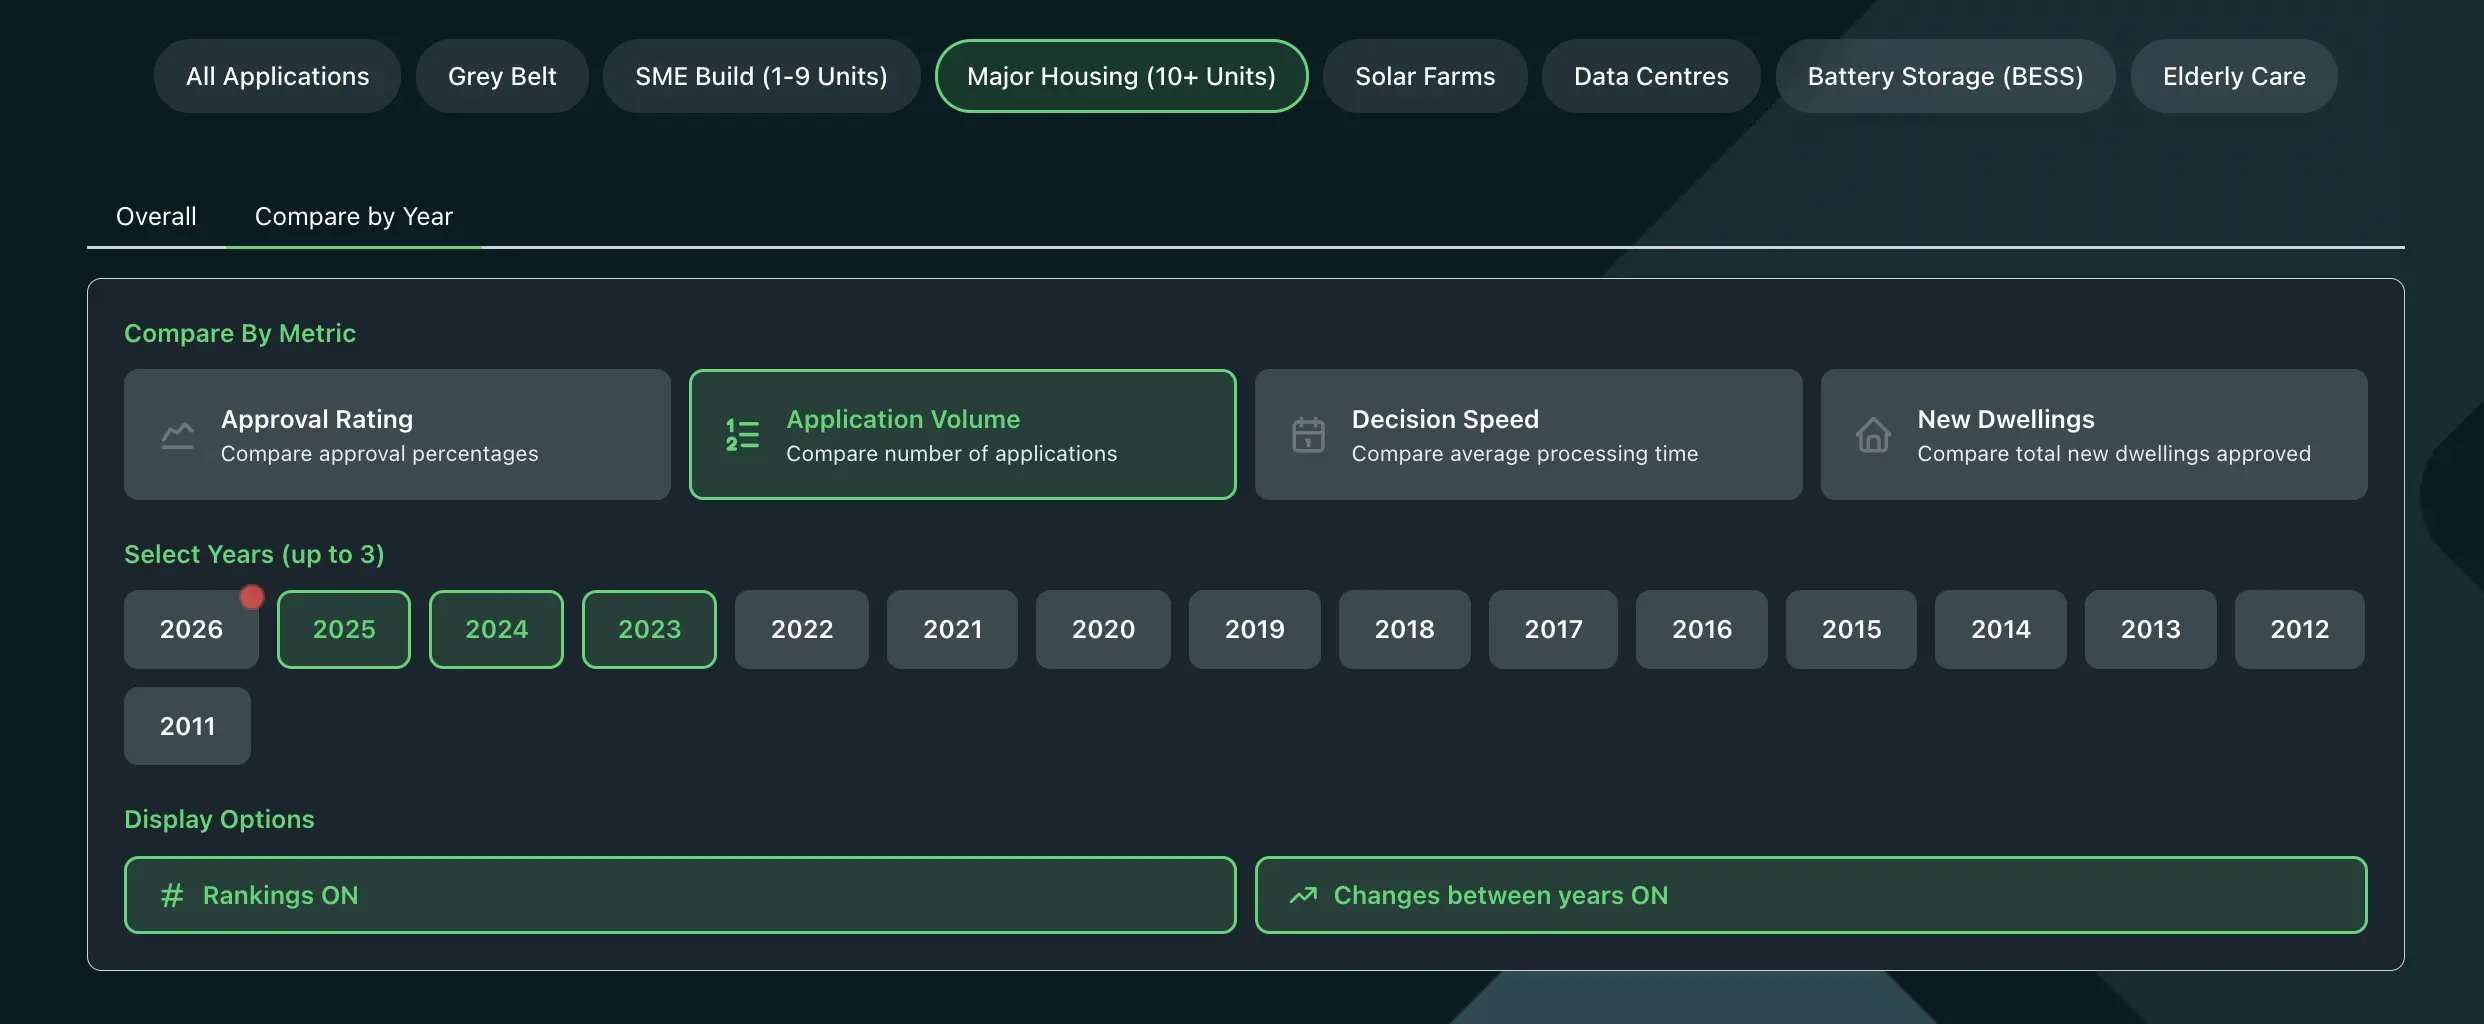
Planning data, broken down by what actually matters
A blended approval rate across all scheme types hides important differences. Major developments behave differently from minor ones. Energy projects behave differently from residential. Policy-sensitive categories behave differently again.
That’s why the leaderboard supports segmentation across development and policy groupings - so the numbers reflect reality, not averages.
Users can break out performance across areas such as:
- Large vs small developments
- Grey belt land opportunities
- Solar planning applications
- BESS planning data
- Renewable energy schemes
The result is a clearer answer to the question that actually matters: not just who approves - but what they approve.
Who is this planning data built for?
This dataset is used by professionals who need planning clarity to support commercial or advisory decisions - where approval probability and authority behaviour directly affect strategy.
That includes planning consultancies, residential and strategic land developers, renewables teams, land promoters, acquisition specialists, and planning data researchers.
In practice, many pair approval performance insight with live site sourcing - focusing effort where planning outcomes are demonstrably more supportive rather than evenly spreading risk.
Powered by Searchland’s national planning dataset
The leaderboard is built on a nationally standardised planning applications and appeals dataset that is continuously cleaned, structured, and maintained.
It’s the same underlying data foundation used for deeper planning research and site-level investigation - from individual application histories through to authority-wide performance benchmarking.
Users don’t just stop at rankings. They move from comparison into investigation, and from investigation into sourcing and appraisal workflows. The leaderboard is one front door into a much wider planning intelligence layer.
Trusted by leading planning consultancies
Planning data only has value if practitioners trust it enough to rely on it in real work. Advisory and development teams use this dataset to benchmark councils, sense-check planning risk, and support evidence-led recommendations.
“Searchland is an invaluable tool for delivering best-in-class planning services.” - Avison Young
“Searchland brings everything together in a convenient and comprehensive format.” - nineteen47
The consistent theme is usability - structured data that removes friction instead of adding to it.
A clearer view of UK planning - past, present and live
By combining historic planning decisions from 2011 onwards with continuously updating live outcomes, the UK Local Planning Authority Planning Applications Leaderboard gives a fuller and more practical picture of how planning really performs.
Across councils.
Across development types.
Across policy cycles.
Across time.
You can explore the live rankings now - or book a demo to see how this planning data can plug directly into your team’s sourcing and appraisal workflow.


